

The November 2022 Toronto real estate numbers are in so it’s time for a deep dive into what they actually mean, instead of what the headlines are saying. Interest among my clients is at an all-time high – people want to know what’s really going on in the market, rather than just what the click-bait headlines are saying.
Each month, I examine the Toronto numbers and give my honest insights based on my 13 years of experience on the ground working in the Toronto market, and my background in finance which helps me analyze the numbers unlike anyone else. I don’t just report them as many do. I examine the numbers to give you the facts that others are missing.
If you’re interested in what’s to come in 2023, you’ll want to be sure to check out my 2023 Toronto Real Estate Guide that I just published. I cover the overall market, and what’s going to happen in each segment including Condos, Detached Homes, Semi & Row Homes, and have even included the pre-construction condo market and the rental market.
I have tips for buyers and sellers, and some tips on key opportunities I see coming within the next year.
You can check it out here: 2023 Toronto Real Estate Guide from TRB
OK, let’s take a look at what was happening in November.
The Overall November Market
Let’s start by looking at the positives in the Toronto market right now. We’re sitting in a very strong Buyer’s Market!! Hooray! But why isn’t anyone talking about that?
During the peak of the market in 2021, all we read about was competition, bidding wars, unfair pricing, buyers being priced out of the Toronto market, and how crazy Toronto Real Estate was.
But now that we’re sitting in a Buyer’s Market for the first time in many, many years, why doesn’t anyone want to talk about that or be excited for BUYERS???
It’s because that type of sentiment doesn’t create click-bait headlines, or cause fear and anxiety among homeowners. It’s tragic that we can’t celebrate for buyers but it’s in fact what we should be doing.
Go Buyers Go!
The Toronto Condo Market
 Let’s take a look at some of the numbers that aren’t traditionally reported:
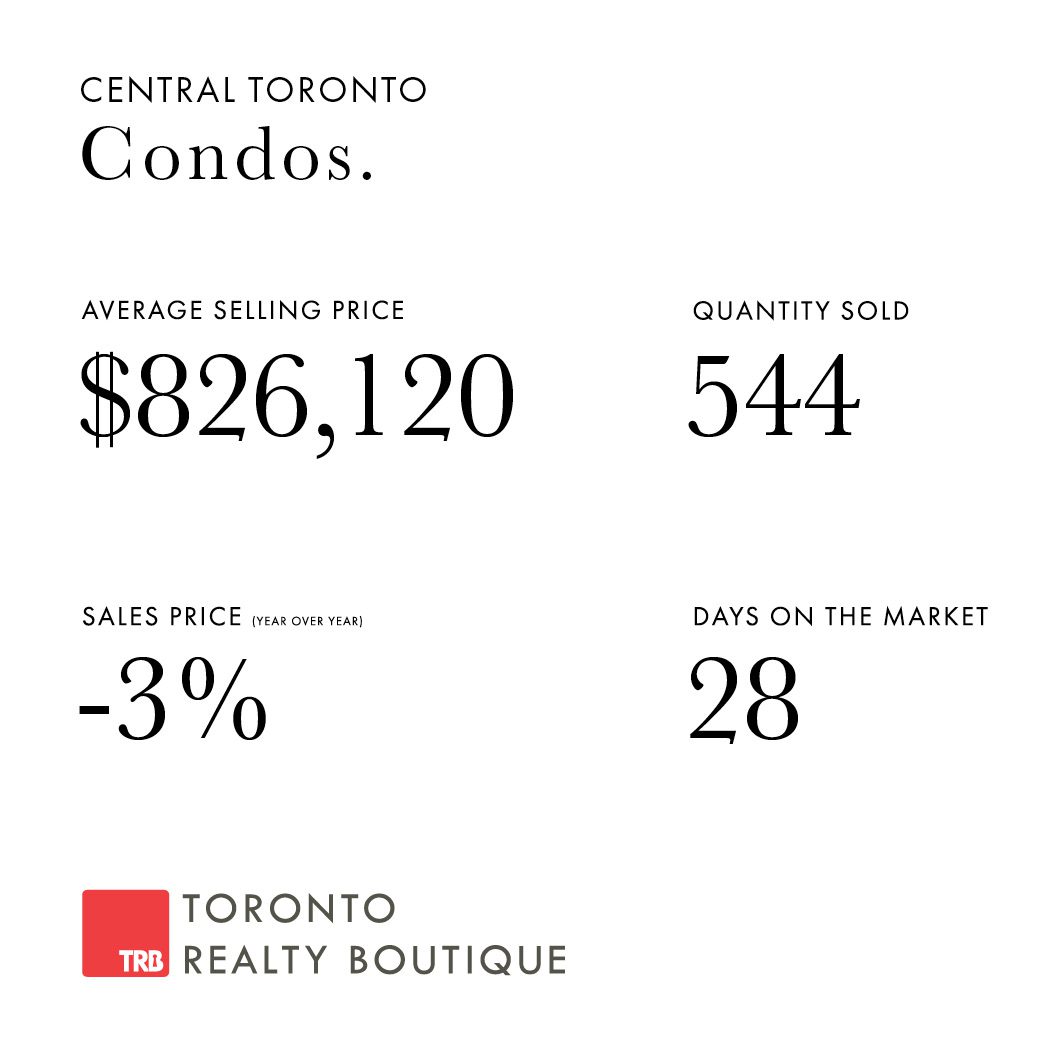
The average price is down 3% year over year
New listings are down 18.2% year over year
Year-over-year transactions are down 53.7%
Average days on the market is up by 4 days
Most people will gasp when they see any number over 50% in the stats but when it comes to the number of transactions, that indicates only one thing. The market is incredibly slow. Buyers continue to hit the pause button and why wouldn’t they? It’s the holiday season, interest rates are up, and many are uncertain about their next move or when they want to take it.
But within the condo segment, it’s incredibly comforting to see signs of stability. And that comes from the pricing indicators. Year-over-year pricing is only down 3% and the month-over-month number is only down 1%. That’s much better than we’ve been seeing so perhaps we’re starting to realize the new interest rates are the new normal, and this is how the market is going to be for the near future.
But for what is actually trading in the market, it shows that sellers are holding firm on their pricing and buyers are willing to pay. There is no pressure to give in on either side – and isn’t that how a fair real estate market actually works?
With that said, new listings are down 18.2% year over year, and quantity sold is down 53.7% year over year.
So, what does that mean? Overall, it’s a good time to buy because as supply does remain low, it’s not being outpaced by the number of active buyers.
So what’s ahead for the last month of 2022? Right now, December is looking to be lower than November, but that’s pretty typical of a December market. Halfway through the month, we’re sitting at 172 sold condos, so even if that doubles, we’re likely to see a dip from the November stats.
November 2022 Toronto Real Estate: Semi-Detached and Row Homes
 Let’s once again start with some of the numbers that aren’t traditionally reported:
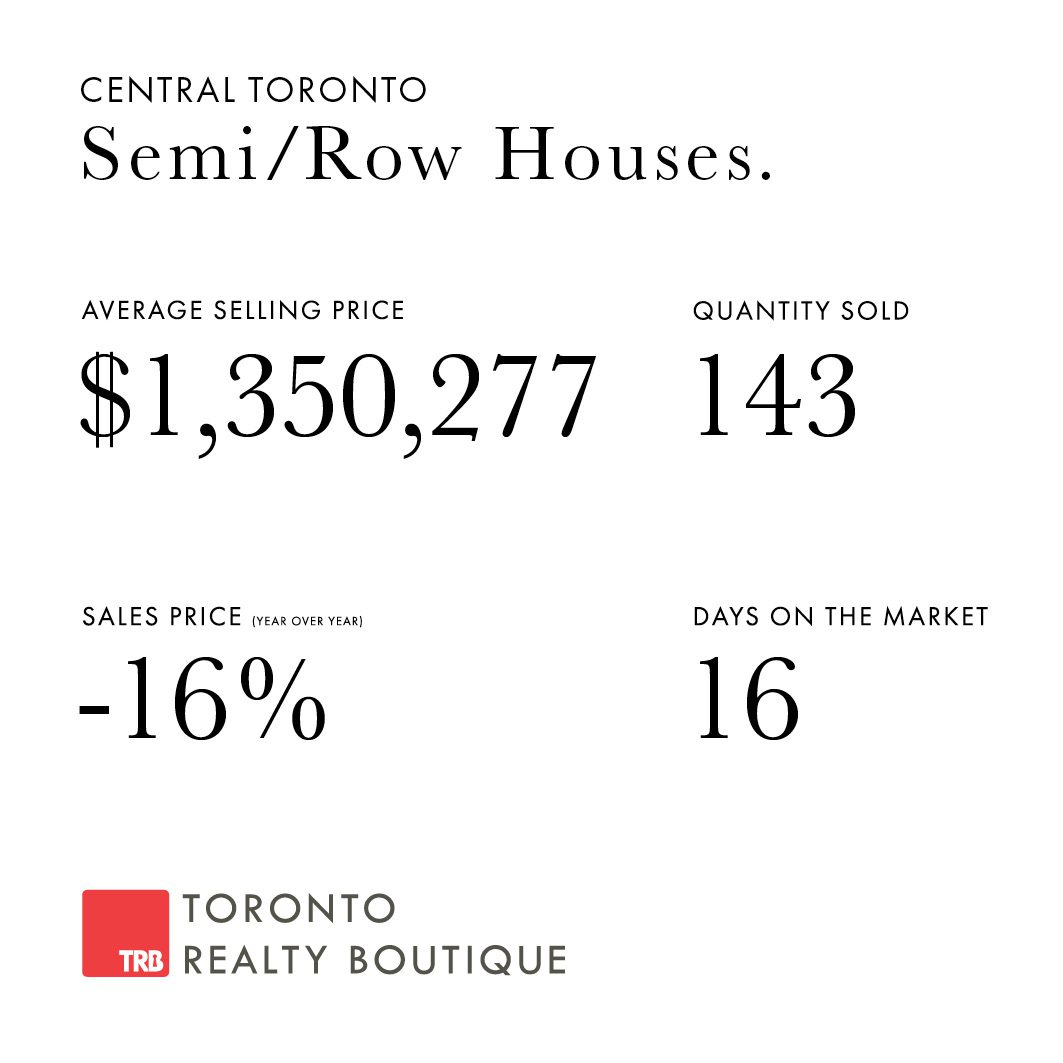
The average price is down 16% year over year
New listings are down less than 1.5% year over year
Year over year transactions are down 37%%
Average days on the market is up by 1 day
These numbers further prove my point that I’ve been making for several months – this winter will be the time to buy. This is because the inventory numbers are consistent year over year, meaning there is still plenty of inventory in the market as during this time in 2021, but the competition is essentially gone.
Month over month, prices in this segment are down 2.5%, indicating that pricing is starting to stabilize. We’re not seeing the double-digit percentage drops that we did earlier this year, so if you’re still waiting for that gigantic drop in pricing, it’s likely not going to come. These single-digit numbers are a very good indication of that.
I like to take a look at the 2020 numbers, removing the inflated market of 2021, and see where things are at. Within the Semi and Row Home segment, when I do this, the numbers are actually slightly up.
November 2020 Average Price: $1,307,146.00
November 2022 Average Price: $1,350,277.00
This isn’t to say we should ignore 2021 entirely but we do have to consider it was a very different market then, and real estate isn’t traded on a monthly or even yearly basis. It’s a long-term investment so these numbers need to be analyzed in many different ways to get the true picture.
November 2022 Toronto Real Estate: Detached Homes
 Here are some of the numbers that aren’t traditionally reported:
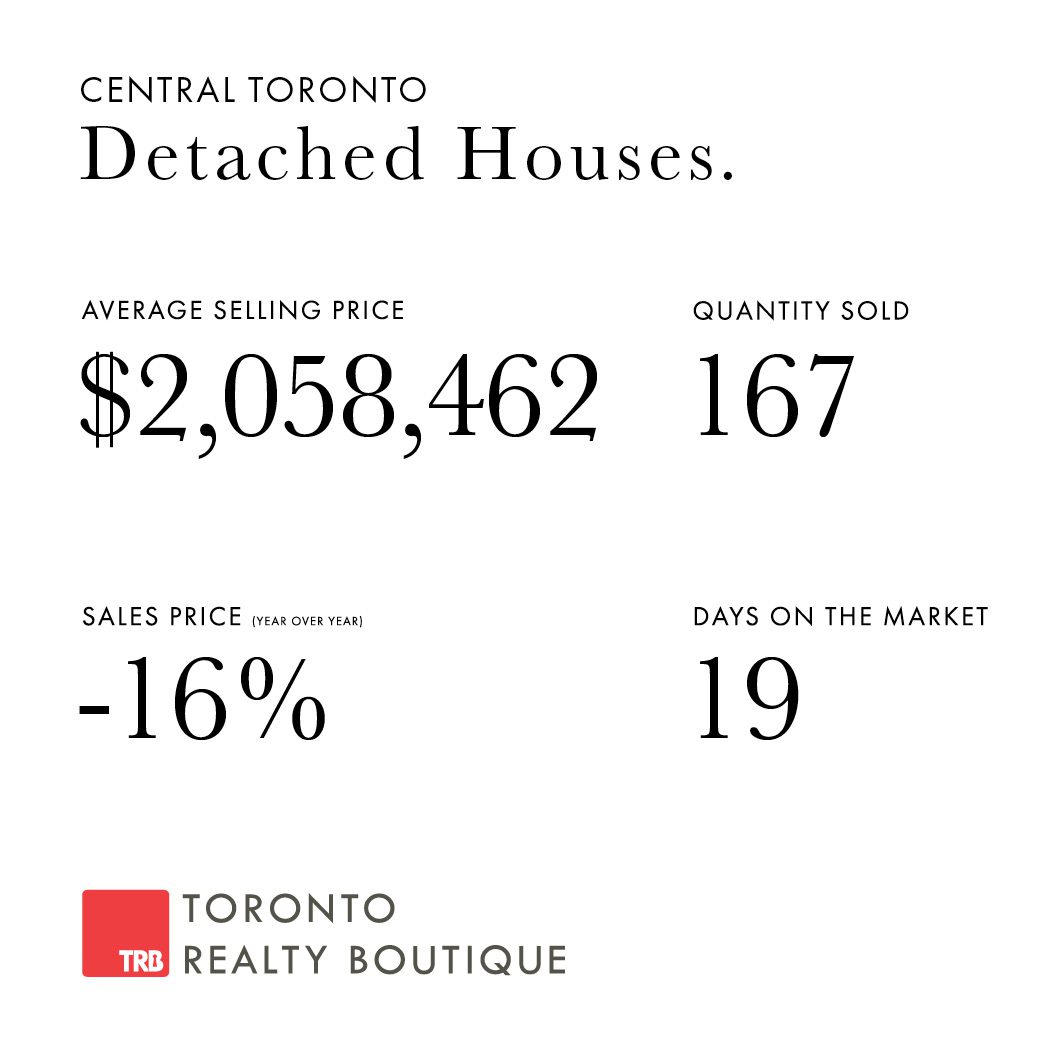
The average price is down 16% year over year
New listings are down less than 10.2% year over year
Year-over-year transactions are down 41.6%
Average days on the market is up by 4 days
The big number that jumps out here is the 41.6% drop in transactions year over year. But again, especially within this segment, the number is usually down during November and December. Not many detached homes are being listed and sold at this time of year. Many people are getting ready for the holidays or going on vacation. Remember – this is the first season post-Covid so many are taking advantage and living life!
But for those buyers who are looking and taking advantage of this buyer’s market, they’re getting into some pretty amazing homes for great prices. There is essentially zero competition for homes so buyers have time on their side. Buyers are obviously taking advantage of that time, as the days on the market is up by 4 days. There is no rush.
Can we possibly credit this time of year to the pricing decrease? Perhaps, but we should also look at that 2020 number again here, taking out the crazy increases of 2021.
November 2020 Average Price: $2,026,249.00
November 2022 Average Price: $2,058,462.00
Again, here we see that this segment is slightly up from 2020. Putting 2021 aside for analysis for just a moment shows us that we’re ok. This segment is ok and will be growing as it always does in the future.
If you’re thinking about buying, selling, or investing and want to discuss strategies, pricing, timing, or anything else, simply complete my form on this page so I can get in touch right away. I’d be happy to answer any questions about the November 2022 Toronto real estate numbers you have or about the Toronto market in general.
~Romey Halabi
Founder & Lead Broker, Toronto Realty Boutique
416-999-1240

TRB Education Hub
Get the real estate resources you need to succeed. Visit our education hub for market insights, guides, podcasts and more.